Creditas financial results Q3-2022

São Paulo, 10th December 2022
Context of the business
In the first nine months of 2022 we posted revenues of R$1,303mn, 173% increase compared to the same period of 2021, maintaining our position as a high growth company while we move our priorities towards profitability during next year.
The business environment continues being extremely volatile, both locally and internationally. In Brazil inflation continues trending down but political and fiscal uncertainties keep long term rates at record highs. Consumers continue suffering from accumulated inflation, lack of investment and high interest rates. Incumbent banks have recently published record provisions, mostly impacted by unsecured credit portfolios in the low-income segments. The tech ecosystem is suffering from the reduced liquidity scenario and most companies have reset their expectations on growth and headcount. Internationally, valuation of tech companies continues being highly deteriorated and even large tech players are announcing slower growth guidelines. A new era is emerging, and our tech industry is moving towards doing more with less and focusing on fundamentals.
At Creditas, we continue executing on a plan-to-profitability designed in March. We are successfully increasing efficiency, operational leverage, and portfolio repricing. We are now originating loans with the highest projected margins that we have ever seen to bring our gross profit back to normal levels, and while the improvement in Q3 is limited due to a temporary deflation impact on the home equity portfolio, we are seeing much more robust trends in Q4 that will continue through 2023. Our credit quality remains strong thanks to our focus on collateralized credit and high-quality customers. And with a more modest portfolio growth, we continue focusing our efforts on reducing customer acquisition cost and optimizing cash flows and return on capital.
Updating on the action plan we designed:
1. Keep portfolio growth high and sustainable: portfolio growth remains high at 90% year-on-year while we slow down quarterly growth to more modest 49% annualized. We continue balancing growth and profitability so that portfolio growth provides future gross profit while keeping an eye on the negative short-term impact related to growth (IFRS provision frontloading and customer acquisition cost).
2. Accelerate repricing of loan portfolio: as anticipated, pre-fixed loans pricing has moved from 32% p.a. in Sep-2021 to 49% p.a. in Sep-2022. However, due to the long-term nature of our loans (4-year average maturity for pre-fixed loans and 15-year for floating loans) our average portfolio pricing has only increased from 32% p.a. to 40% p.a. which creates a strong backlog of portfolio price increase over the next 12-18 months for an additional 9% spread to build gross profit expansion, something that could even accelerate with SELIC reductions in H2-23.
3. Increase gross profit: after gross profit compression during second half of 2021 and early 2022 due to high growth (IFRS provisions impact) and raising interest rates (funding cost impact) we are now experiencing the reverse effect with gross profit margin expanding for the first time in Q3-22. We expect this trend to continue through 2022 and 2023 to regain 40-50% gross profit margins. The combination of loan repricing, growing portfolio, stabilized cost of funding and lower IFRS provision impact create significant tailwinds for our profitability. As we will discuss later in our financial performance, despite record-high inflation and interest rates, we have not seen a significant deterioration of credit quality and our portfolios remain highly resilient. We expect the impact of the cycle to remain minor in our gross profit due to the presence of collaterals in all our financial products, something that we are already seeing as Q3-2022 has been the first quarter in which we see a reduction in the cost of credit of our portfolio.
4. Acquisition of Andbank’s Brazilian banking operations: after signing the acquisition agreement in July, Andbank completed the capital increase following the authorization from both Brazilian and European authorities, strengthening the balance sheet and accelerating deposits growth.
5. Reduction of customer acquisition cost: we have managed to bring our customer acquisition cost to the minimum level ever thanks to (i) the impact of our automation efforts in lowering acquisition cost and increasing conversion and (ii) returning users and repeating customers now representing the majority of our new loan origination. In addition, as portfolio grows and loan repricing is materialized, CAC represents a significantly lower portion of our revenues.
6. Rationalizing our overhead: with significantly reduced hiring after March 2022, we continue increasing productivity per employee and expect to continue gaining operational leverage over the next quarters into 2023.
Financial results
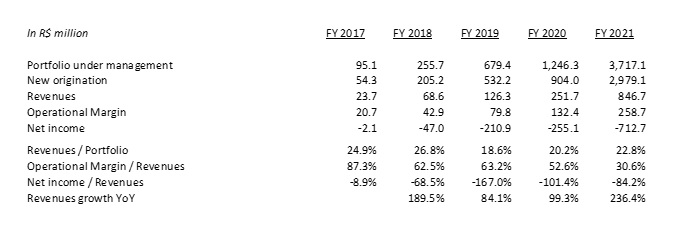
Annual results for the years 2017 through 2021
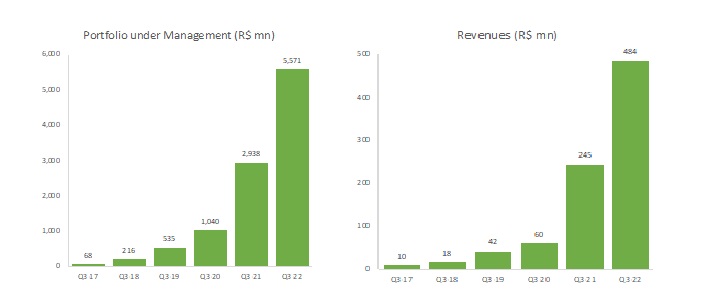
Quarterly results for the period Q3-2021 through Q3-2022

Operational performance
Revenues of Q3-2022 posted at record R$484.2mn compared to R$244.6mn in Q3-2021, a 98% increase despite the reduction in portfolio growth rates and a strong impact of deflation in the Q3-2022 revenues. Portfolio under management reached R$5,571mn compared to R$2,938mn in Q3-2021, a 90% increase YoY.
As we have recently stated, in the second half of 2022 we are targeting a more modest 40-50% annualized growth rates as we take a more conservative growth strategy with lower approval rates and focus on portfolio repricing. We continue targeting a 100%+ growth revenue growth for FY-22 building a strong base for FY-23.
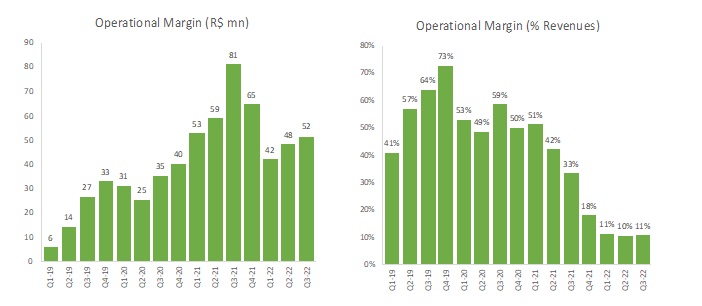
We saw gross profit margins bottoming in Q2-2022 due to the impact of the sharp SELIC increase and the impact of IFRS provisioning frontloading related to our high growth strategy. In Q3-2022 we are already seeing a small recovery mostly driven by the first reduction of credit provisions that we have seen in our recent history. This credit performance is remarkable considering the recently reported provision increases in most financial players. On the other side, the impact of the loan repricing which is very apparent in our pre-fixed portfolio was shadowed by the impact of deflation in our floating portfolio due to different periods of inflation adjustment of that portfolio for our home equity loans compared to our CRI investors.
As previously discussed, our steady state gross profit margins should be in the 40-45% range after considering cost of funding and IFRS provisions. In periods of lowering SELIC, such as 2016-17 and 2019, we experience margin expansion (see margins reaching 70% in 2019 in chart below); conversely, in periods with raising SELIC such as 2020-21, we experience margin compression (see margins bottoming at 10% in Q2-22). Growth plays a significant role in short-term gross profit margin results as well, since the higher the growth (i.e., Q3-21 through Q2-22) the higher the impact of frontloading provisions under IFRS.
The chart below shows the bridge between our steady-state gross profit margin (42%) and our Q3-2022 margin (11%):
20% of gross profit margin (63% of the difference) is linked to the evolution of interest rates (mismatch between pre-fixed loans and floating funding sources) and the deflationary months impacting Q3-2022
6% of gross profit margin (19% of the difference) is linked to our portfolio growth, as IFRS frontloads future credit provisions without any consideration of the credit behavior
6% of gross profit margin (18% of difference) is related to aging of our portfolio cohorts above our expected credit losses

Inflation has been trending down in Brazil and is now pointing to 5.7% by end of year as Brazilian Central Bank did a good job in raising rates before any other Central Bank in the world. Despite these positive trends, uncertain fiscal scenario has moved 2024 swap rates to record high 14.5%, a sign of volatility ahead and potential delays of interest rate cuts in 2023. The Dec-2nd Focus report pointed to an expectation of SELIC falling from current 13.75% to 11.75% by end of 2023 (previously expected lower at 11.25%) and 8.50% by end of 2024. At this levels and current pricing, we would recover ~40% gross profit margins by end of next year.

Below gross profit margin we recognize 2 types of costs: (i) Customer Acquisition Costs that, despite generating gross profit over many years due to the long-term nature of the loans we originate, we recognize upfront and (ii) overhead costs, mostly related to product technology, a cost that unlike some incumbents, we don’t currently activate. As we continue building our portfolio, the impact of both CAC and overhead comes down on a relative basis as we get operational leverage thanks to scale. We expect both costs to come down significantly over the next quarters as we continue growing our revenues and gross profit margins well above the evolution of CAC and overhead. All in, our path to profitability is related to (i) expanding gross profit related to stabilization of SELIC, portfolio repricing and lower impact of frontloading IFRS provisions, (ii) lower impact of customer acquisition cost as portfolio builds and we get higher efficiency in acquiring customers through our own user base and (iii) operational leverage as we continue growing our revenue base to absorb existing overhead that will grow at a significantly lower pace.


***
Definitions
We present all our financials under IFRS (International Financial Reporting Standards). The key definitions of our financial and operational metrics are below:
Portfolio under management – Includes (i) Outstanding balance of all our lending products net of write-offs and (ii) outstanding premiums of our insurance business. Our credit portfolio is mostly securitized in ring-fenced vehicles and funded by both institutional and retail investors. Our insurance portfolio is underwritten by 14 insurance carriers.
New Origination – Includes (i) volume of new loans granted and (ii) net insurance premiums issued in the period. If new loans refinance outstanding loans at Creditas, new loan origination includes only the net increase in the customer loan.
Revenues - Income received from our operating activities including (i) recurrent interest from the credit portfolio, (ii) recurrent servicing fees paid by the customers from the credit portfolio related to our collection activities, (iii) up-front fees charged to our customers at the time of origination, (iv) take rate of the insurance premiums issued, (v) total price of cars sold and (vi) other revenues from both lending and non-lending products.
Gross Profit Margin - Margin calculation deducts from our revenues (i) funding costs of our portfolio comprising interests paid to investors, (ii) credit provisions related to our credit portfolio which, under IFRS, are significantly frontloaded to account for future losses and (iii) acquiring and preparation costs of vehicles sold.
Net Income - Net income deducts from our Operational Margin (i) costs of servicing our portfolio, including headcount, (ii) funds operational costs (e.g. auditors, rating, administration fees, etc), (iii) general and administrative expenses, including overhead, (iv) customer acquisition costs, (v) taxes and (vi) other income and expenses. We currently don’t activate any of our technology investments which include third party providers, third party platforms and salaries of our product technology team.
Subscribe for
updates
Receive all our news in your email